GT Analytics
GT Analytics™ provides a simple way to monitor the workflow queues associated with eForms. This powerful tool searches eForms based on criteria such as form type and status, date ranges, participants, etc. and shows summary charts and eForm details of the search results. Charts give a visual picture of your automated processes, with graphical comparisons to the broader organization.
This BoltOn was developed for GT eForms 3.3x and has not been tested or updated for GT eForms 3.50.00 or subsequent versions. There is a Solution Template called 'PeopleSoft Insights for GT eForms' which is currently under development and will fill the role of GT Analytics for versions of GT eForms above 3.50.00. Clients interested in either of these solutions should reach out to support@gideontaylor.com.
Users access the reports from the GT eForms Workcenter, which is also where forms are created and managed. Depending on access levels, users can see reports for forms they created or admin level forms.
Users can click on the chart to drill into form details.
Additional prompts can be accessed by clicking on the gear icon under the form heading and selecting Prompt.
Security
Any user with access to the WorkCenter will be able to access the Reports tab. Under the Reports tab, all users will be able to access the My Reports family that will show the My eForms link and associated reports. However, in order to see the GT Analytics family and associated reports, a user must have the GT Analytics User role, or the permission list associated with the GT Analytics role.
GT Analytics User Role
The GT Analytics User role uses the G3ANALYTICS permission list. This permission list grants access to several necessary components, as well as a Query Access Group.
| Query Access Group |
|---|
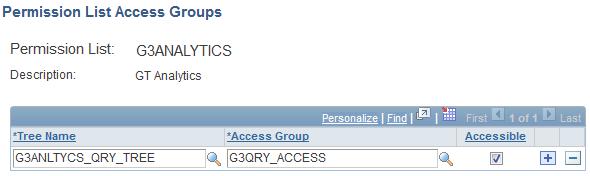 |
This query access group contains all the tables used in compiling the analytics reports and is required to access the reports on each report link.
Reports Tab
My eForms
The My eForms link shows all forms originated by the current user. The report can be filtered by form status, form type, or key field search.
| My eForms |
|---|
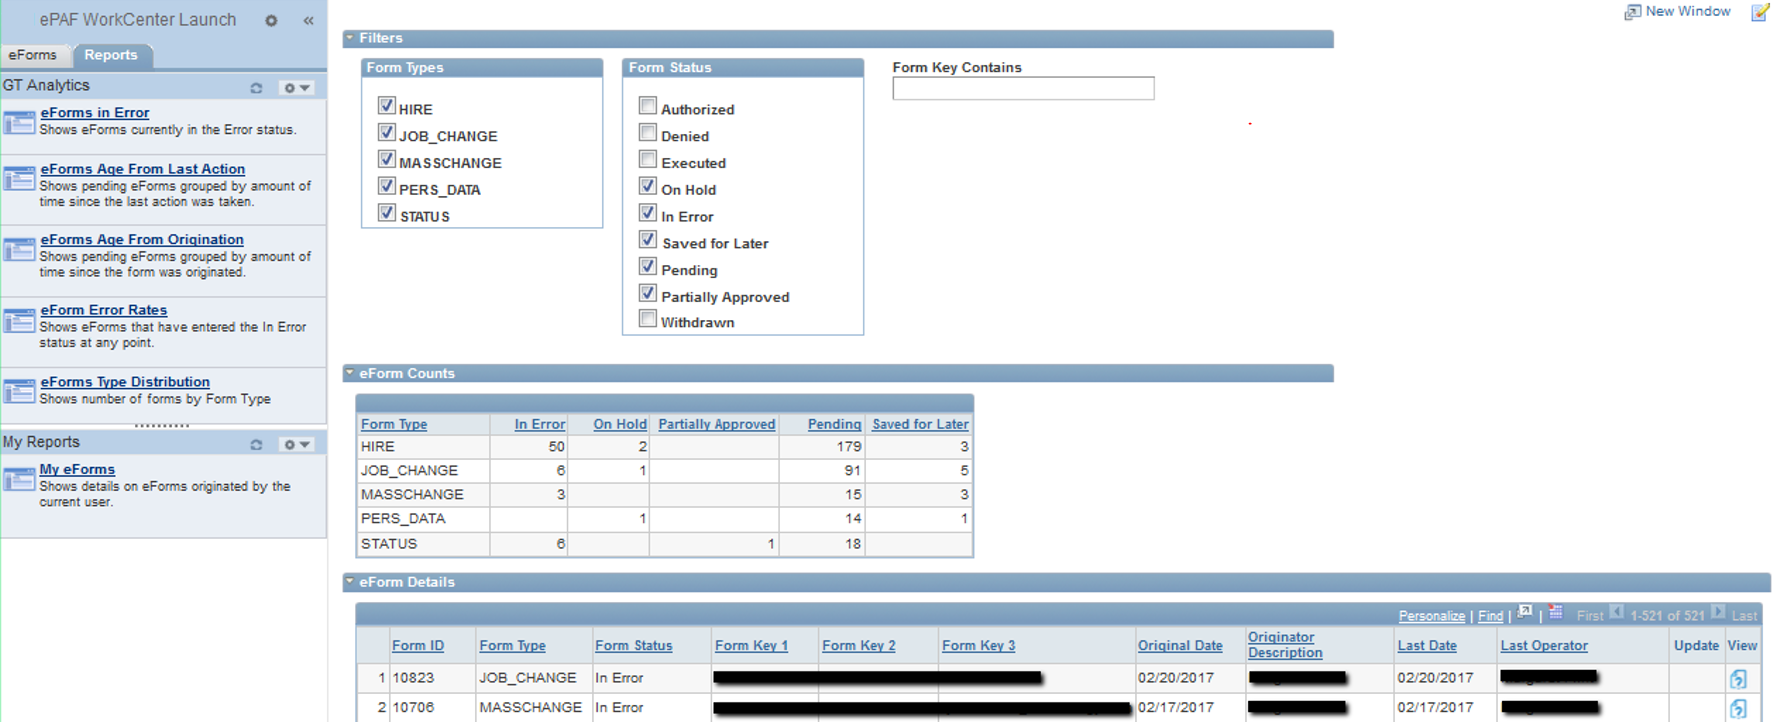 |
Filters
The Filters segment allows the user to filter based on Form Types, Form Status and Form Key.
- Form Types – only form types submitted by the user will be available in this section. All forms will be enabled by default.
- Form Status – allows users to show a count of forms in a certain form status. Counts appear in the eForm Counts section below.
- Form Key Search – use this field to search for a particular value amongst form key data.
- Use the Admin Tool/Form List tab to identify form key fields
| My eForms Filters |
|---|
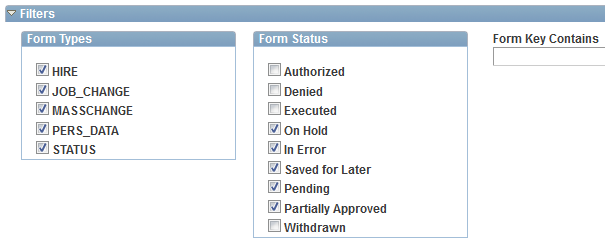 |
eForm Counts
The eForm Counts segment shows the results from the form filters above. This grid shows counts of the selected form types in the selected status.
| eForm Counts with all statuses |
|---|
 |
eForm Details
The eForm Details grid shows a list of all the forms matching the filter criteria. The column headings have the ability to be sorted (except the columns for Update and View since they are links). The three columns for Form Keys shows the first 3 form keys for each form. Note that some form keys will not necessarily be populated.
If an icon is available in the Update and/or View columns, then the user may click the icon to open the form in update or view mode, respectively.
GT Analytics Tab
This section describes delivered functionality for each Analytics report.
eForms in Error
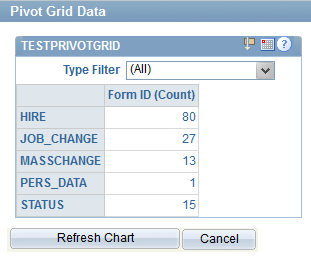
Shows the count of forms that are currently in an error by form type. The report can be filtered by form type and date range.
Filters and Options
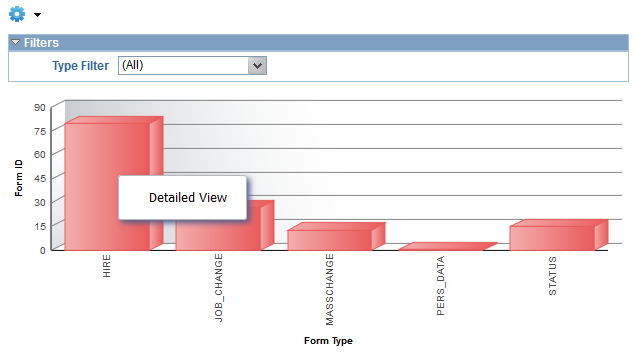
Use filters and options to adjust the chart output. Available filters appear in the filter window at the top of the screen. Click the options menu (cog wheel icon) to select from additional options (below). Filters and options are user-specific.
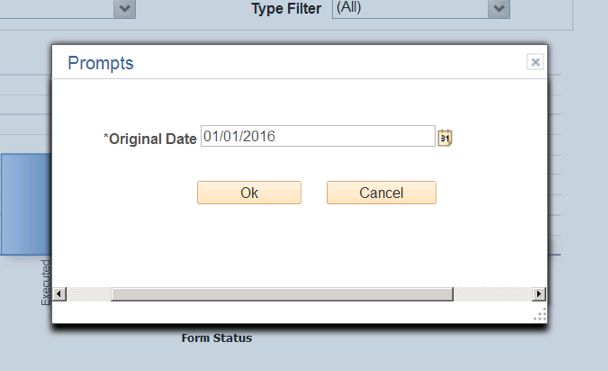
Prompt:
Prompt on original date to restrict the results from the origination date of the form.
View Grid:
Click this option to see the chart data in grid format.
| Field | Description |
|---|---|
| Type Filter | Defaults to all form types. Use this dropdown to change the form selection. Select one or more form types and click the OK button to refresh the output.  |
| Results Grid | Shows the count totals for forms in error. |
| Form ID (Count) | Click on the count total to drill into a summary list of forms in error (see image above) |
| Grid Drilldown | View Form ID, Form Type, Condition, Type Filter, Originator and Last Operator. 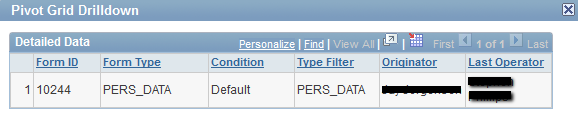 |
Export Data
Click this option to export report results to an Excel table.
Chart Options
Click this option to change certain chart details.
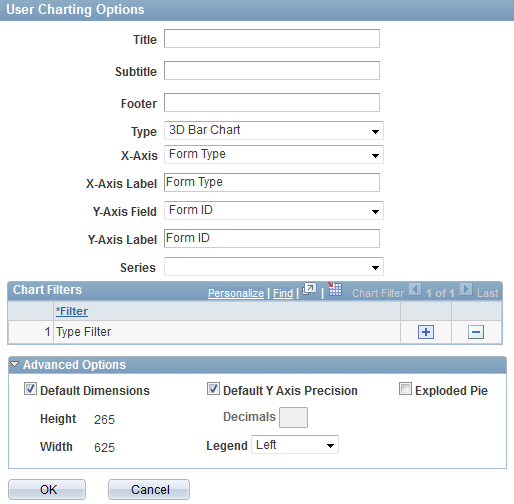
| Field | Description |
|---|---|
| Title | Add a chart title |
| Subtitle | Add a chart subtitle |
| Footer | Add a chart footer |
| Type | Change chart type |
| X-Axis | Change the criteria for the x-axis |
| X-Axis label | Change x-axis label |
| Y-Axis | Change the criteria for the y-axis |
| Y-Axis label | Change the y-axis label |
| Series | Choose a different data set to display on the chart |
Advanced
| Field | Description |
|---|---|
| Default Dimensions | Defaults to ON with a defined height and width. Uncheck the dimensions checkbox to adjust the height and width. |
| Default Y-Axis Precision | Uncheck the box to add decimal level precision to the y-axis |
| Legend | Change the orientation of the chart legend. Choose bottom, right, left, none, or top |
| Exploded Pie | For pie chart types, check this box to show each section of the pie as distinct |
Save
Click to save new chart options.
Chart Views
Click the chart icons to quickly change the chart type.

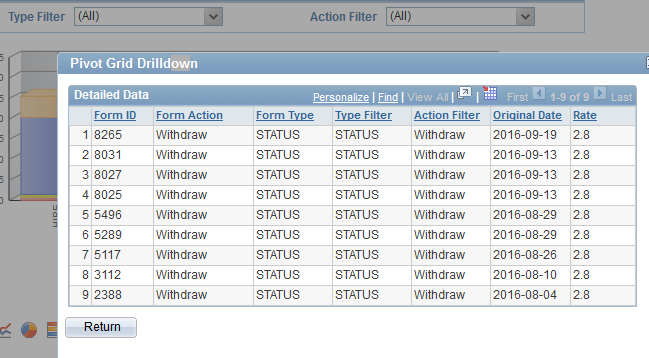
Click on a chart section, then click “Detailed View” to drill into the summary of the data within that section. Note that the summary table appears the same as the summary table from the grid drilldown.
Age From Last Action
This chart shows pending forms grouped by the amount of time since the last action was taken. The report can be filtered by form status, form type, age filter and date range.
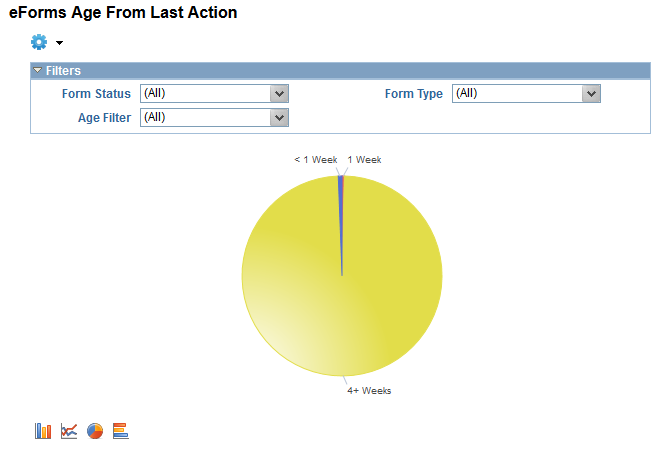
Filters and Options
Use filters and options to adjust the chart output. Available filters appear in the filter window at the top of the screen. Click the options menu (cog wheel icon) to select from additional options (below). Filters and options are user-specific.
Prompt:
Prompt on original date to restrict the results from the origination date of the form.
View Grid:
Click this option to see the chart data in grid format.
| Field | Description |
|---|---|
| Form Type | Defaults to all form types. Use this dropdown to change the form selection. Select one or more form types and click the OK button to refresh the output. |
| Form Status | Defaults to all statuses. Use this dropdown to change the status selection. |
| Age Filter | Defaults to all date ranges. Use this dropdown to change the age range selection. |
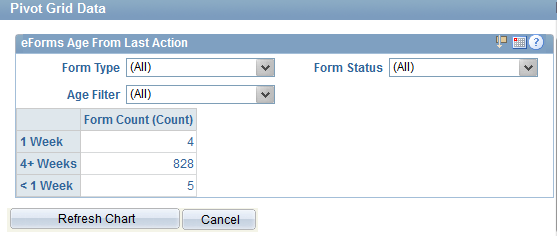
| Results Grid | Shows the total forms in the selected status by age range. |
| Form ID (Count) | Click on the count total to drill into a summary list of forms in error (see image above) |
| Grid Drilldown | Grid view shows Form Count, Form Type, Form Status, Original Date, Originator, Last Date, Last Operator, Last Age, Current Age and Age Filter. 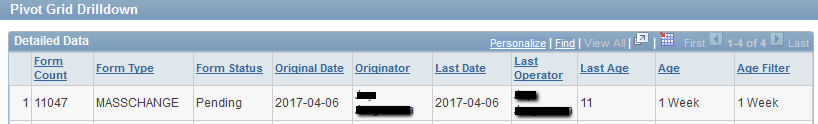 |
Export Data:
Click this option to export report results to an Excel table.
Chart Options
Click this option to change certain chart details, as seen in images in “eForms in Error” section above.
Save
Click to save new chart options.
Chart Views
Use the chart type icons to change the chart view. Click on any segment of the chart to see a detailed view of that chart data. Icons same as image shown in “eForms in Error” section above.
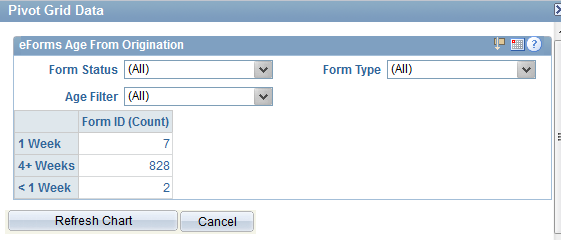
Age From Origination
Shows pending forms grouped by the amount of time since the form was created. The report can be filtered by form status, form type, age filter and date range.
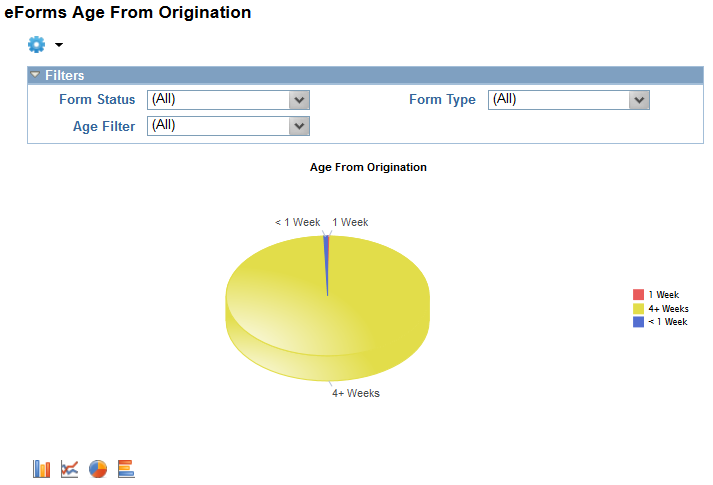
Filters and Options
Use filters and options to adjust the chart output. Available filters appear in the filter window at the top of the screen. Click the options menu (cog wheel icon) to select from additional options (below). Filters and options are user-specific.
Prompt:
Prompt on original date to restrict the results from the origination date of the form.
View Grid:
Click this option to see the chart data in a grid format.
| Field | Description |
|---|---|
| Form Type | Defaults to all form types. Use this dropdown to change the form selection. Select one or more form types and click the OK button to refresh the output. |
| Form Status | Defaults to all statuses. Use this dropdown to change the status selection. |
| Age Filter | Defaults to all date ranges. Use this dropdown to change the age range selection. |
| Results Grid | Shows the count totals of forms since their origination. |
| Form ID (Count) | Click on the count total to drill into a summary list of forms in error. |
| Grid Drilldown | Grid view shows Form ID, Form Type, Form Status, Original Date, Originator, Age, Age Group, Age Filter, Last Date, and Last Operator. 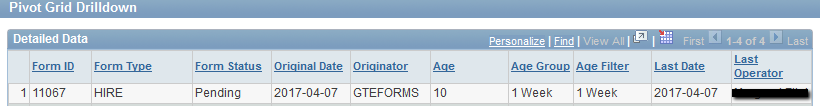 |
Export Data:
Click this option to export report results to an Excel table.
Chart Options
Click this option to change certain chart details, as seen in images in “eForms in Error” section above.
Save
Click to save new chart options.
Chart Views
Use the chart type icons to change the chart view. Click on any segment of the chart to see a detailed view of that chart data. Icons same as image shown in “eForms in Error” section above.
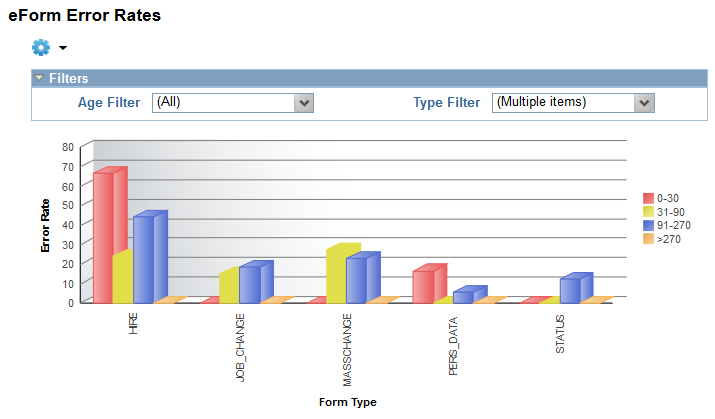
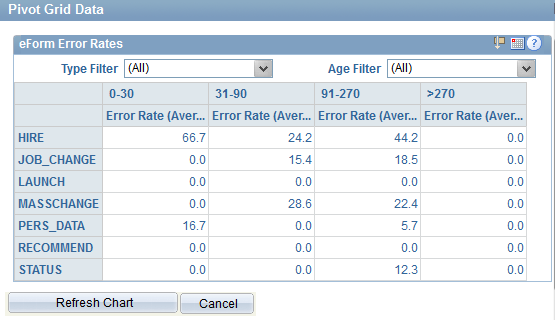
Error Rates
Shows percentage of eForms that have been in an Error status at some point, including forms that are no longer in an error status. The report can be filtered by form type and age range. Forms with a high percentage could indicate an issue that may need to be addressed in the Component Interface.
Filters and Options
Use filters and options to adjust the chart output. Available filters appear in the filter window at the top of the screen. Click the options menu (cog wheel icon) to select from additional options (below). Filters and options are user-specific.
This chart does not have a prompt option.
Prompt:
Prompt on original date to restrict the results from the origination date of the form.
View Grid:
Click this option to see the chart data in grid format.
| Field | Description |
|---|---|
| Form Type | Defaults to all form types. Use this dropdown to change the form selection. Select one or more form types and click the OK button to refresh the output. |
| Age Filter | Defaults to all date ranges. Use this dropdown to change the age range selection. |
| Results Grid | Shows the count totals for forms error rates by date range. |
| Form ID (Count) | Click on the count total to drill into a summary list of forms in error. |
| Grid Drilldown | Grid view shows Form Type, Age Group, Error Count, Count, Error Rate, Type Filter, and Age Filter. 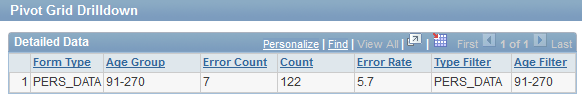 |
Export Data:
Click this option to export report results to an Excel table.
Chart Options
Click this option to change certain chart details, as seen in images in “eForms in Error” section above.
Save
Click to save new chart options.
Chart Views
Use the chart type icons to change the chart view. Click on any segment of the chart to see a detailed view of that chart data. Icons same as image shown in “eForms in Error” section above.
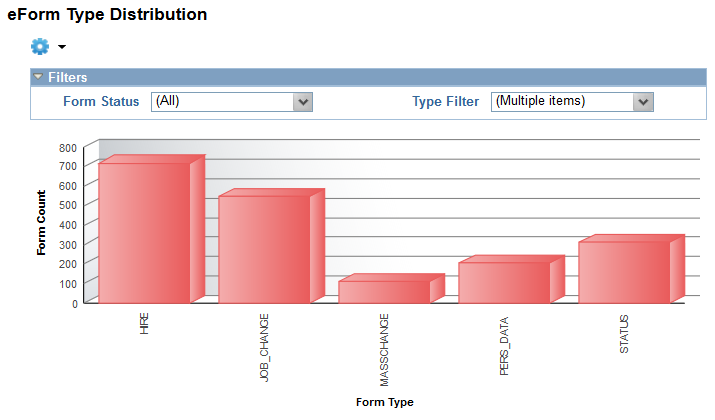
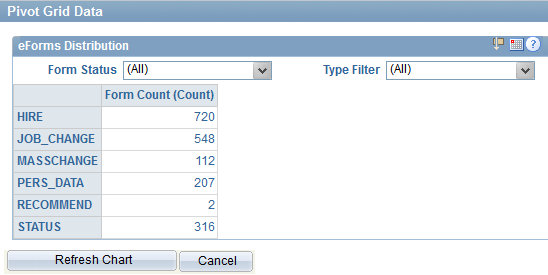
Form Type Distribution
Shows total form count by form type. The report can be filtered by form status, form type and date range.
Filters and Options
Use filters and options to adjust the chart output. Available filters appear in the filter window at the top of the screen. Click the options menu (cog wheel icon) to select from additional options (below). Filters and options are user-specific.
Prompt:
Prompt on original date to restrict the results from the origination date of the form.
View Grid:
Click this option to see the chart data in grid format.
| Field | Description |
|---|---|
| Form Type | Defaults to all form types. Use this dropdown to change the form selection. Select one or more form types and click the OK button to refresh the output. |
| Form Status | Defaults to all statuses. Use this dropdown to change the status selection. |
| Results Grid | Shows the count totals for forms by status. |
| Form ID (Count) | Click on the count total to drill into a summary list of forms in error. |
| Grid Drilldown | Grid view shows Form Type, Age Group, Error Count, Count, Error Rate, Type Filter, and Age Filter. |
Export Data:
Click this option to export report results to an Excel table.
Chart Options
Click this option to change certain chart details, as seen in images in “eForms in Error” section above.
Save
Click to save new chart options.
Chart Views
Use the chart type icons to change the chart view. Click on any segment of the chart to see a detailed view of that chart data. Icons same as image shown in “eForms in Error” section above.
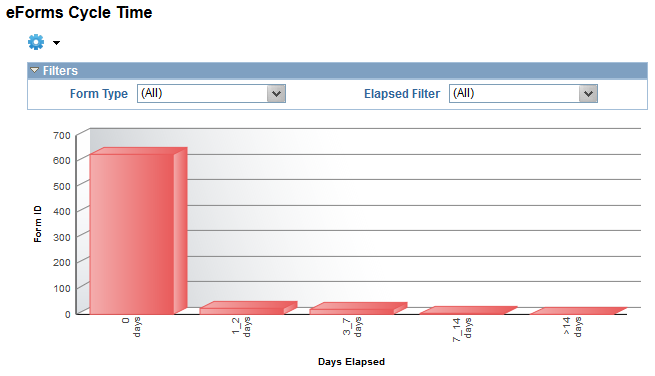
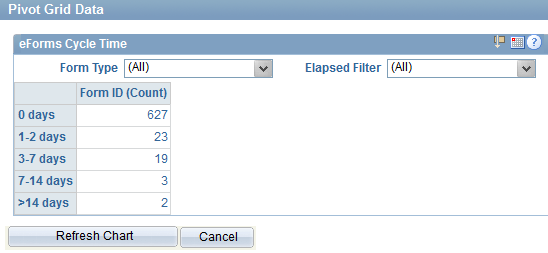
Cycle Time
Shows average length of time for forms from origination to execution by form type. The report can be filtered by form type, days elapsed and date range.
Filters and Options
Use filters and options to adjust the chart output. Available filters appear in the filter window at the top of the screen. Click the options menu (cog wheel icon) to select from additional options (below). Filters and options are user-specific.
Prompt:
Prompt on original date to restrict the results from the origination date of the form.
View Grid:
Click this option to see the chart data in grid format.
| Field | Description |
|---|---|
| Form Type | Defaults to all form types. Use this dropdown to change the form selection. Select one or more form types and click the OK button to refresh the output. |
| Elapsed Filter | Defaults to all day ranges. Use this dropdown to change the elapsed days selection. |
| Results Grid | Shows the count totals for forms by cycle times. |
| Form ID (Count) | Click on the count total to drill into a summary list of forms in error. |
| Grid Drilldown | Grid view shows Form ID, Form Type, Original Date, Originator, Last Date, Last Operator, Cycle Time, Days Elapsed, Elapsed Filter, Step Title, and Time Elapsed. 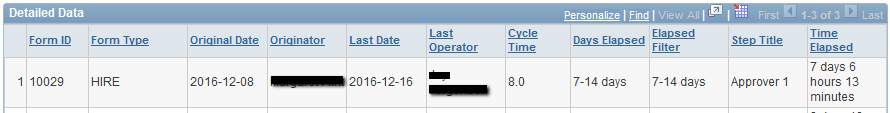 |
Export Data:
Click this option to export report results to an Excel table.
Chart Options
Click this option to change certain chart details, as seen in images in “eForms in Error” section above.
Save
Click to save new chart options.
Chart Views
Use the chart type icons to change the chart view. Click on any segment of the chart to see a detailed view of that chart data. Icons same as image shown in “eForms in Error” section above.
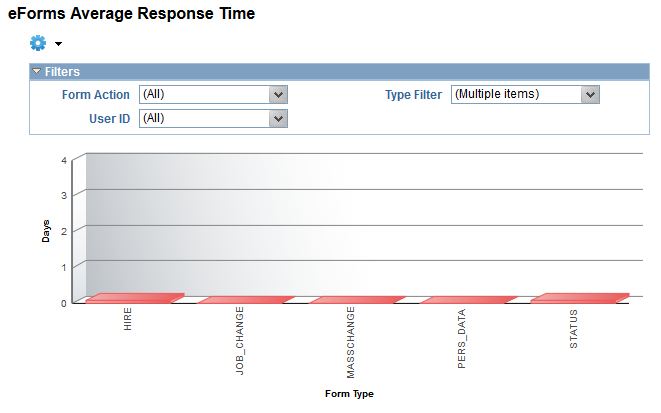
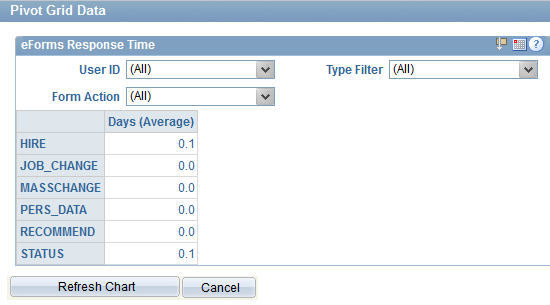
Average Response Time
Shows average length of time the form is at one step before it is completed. The report can be filtered by form action, form type, and user ID.
Filters and Options
Use filters and options to adjust the chart output. Available filters appear in the filter window at the top of the screen. Click the options menu (cog wheel icon) to select from additional options (below). Filters and options are user-specific.
Prompt:
Prompt on original date to restrict the results from the origination date of the form.
View Grid:
Click this option to see the chart data in grid format.
| Field | Description |
|---|---|
| User ID | Defaults to all user IDs. Use this dropdown to change the user ID selection. Select a single user ID to check response times for that individual. |
| Form Type | Defaults to all form types. Use this dropdown to change the form selection. Select one or more form types and click the OK button to refresh the output. |
| Form Action | Defaults to all form actions. Use this dropdown to change the Form Action selection. Use the Form Action to check the response time for specific form actions. |
| Results Grid | Shows the average response time in days for each form by all users or filtered by specific users. |
| Form ID (Count) | Click on the count total to drill into a summary list of forms in error. |
| Grid Drilldown | Grid data shows Form ID, Form Type, User ID, Type Filter, Form Action, Days, and Time Elapsed.  |
Export Data:
Click this option to export report results to an Excel table.
Chart Options
Click this option to change certain chart details, as seen in images in “eForms in Error” section above.
Save
Click save to save new chart options.
Chart Views
Use the chart type icons to change the chart view. Click on any segment of the chart to see a detailed view of that chart data. Icons same as image shown in “eForms in Error” section above.
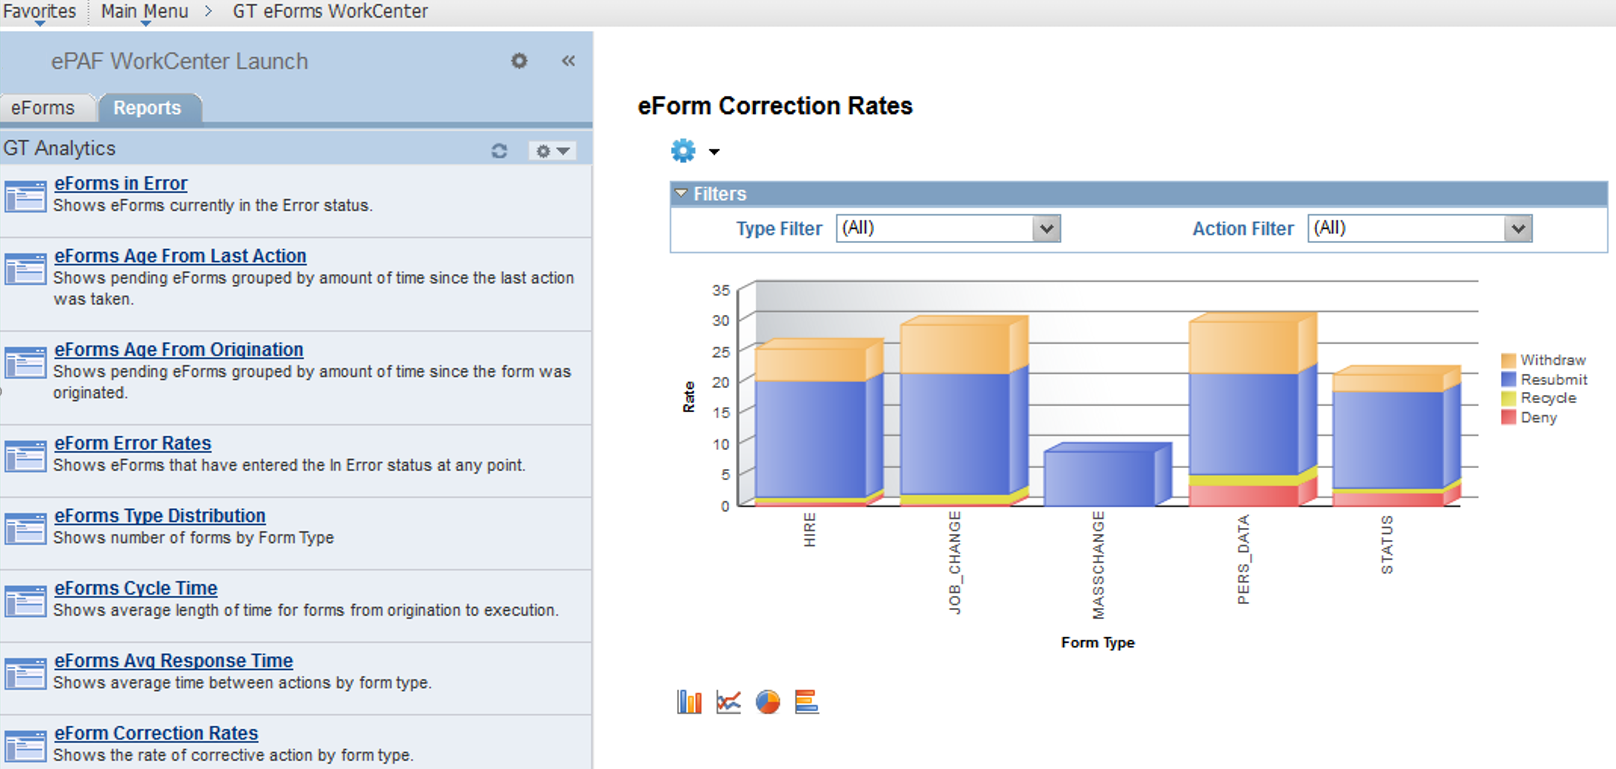
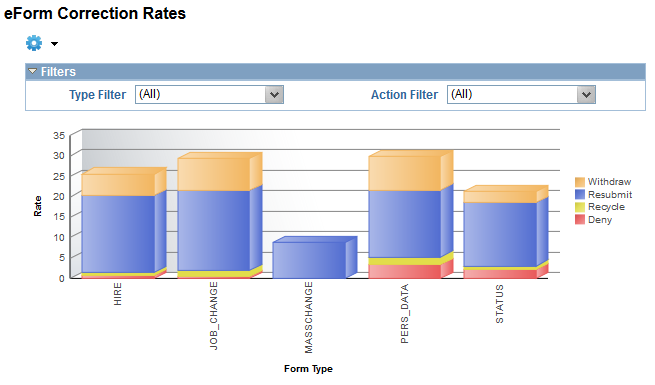
Correction rates
Shows the total number of times a form is denied, withdrawn, resubmitted, or recycled by form type. The report can be filtered by form type, action, and date range. A high count in one of these areas could indicate a need for more training or an updated form design.
Filters and Options
Use filters and options to adjust the chart output. Available filters appear in the filter window at the top of the screen. Click the options menu (cog wheel icon) to select from additional options (below). Filters and options are user-specific.
Prompt:
Prompt on original date to restrict the results from the origination date of the form.
View Grid:
Click this option to see the chart data in grid format.
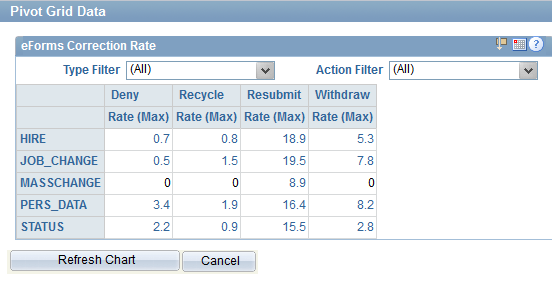
| Field | Description |
|---|---|
| Type Filter | Defaults to all form types. Use this dropdown to change the form selection. Select one or more form types and click the OK button to refresh the output. |
| Form Action | Defaults to all form actions. Use this dropdown to change the Form Action selection. Use the Form Action to check the response time for specific form actions. |
| Results Grid | Shows the rate of corrections by corrective action and form type. |
| Form ID (Count) | Click on the count total to drill into a summary list of forms in error. |
| Grid Drilldown | Grid view shows Form ID, Form Action, Form Type, Type Filter, Action Filter, Original Date, and Rate. 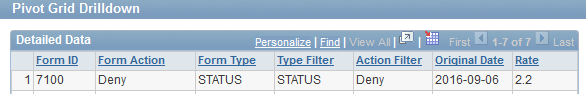 |
Export Data:
Click this option to export report results to an Excel table.
Chart Options
Click this option to change certain chart details, as seen in images in “eForms in Error” section above.
Save
Click to save new chart options.
Chart Views
Use the chart type icons to change the chart view. Click on any segment of the chart to see a detailed view of that chart data. Icons same as image shown in “eForms in Error” section above.