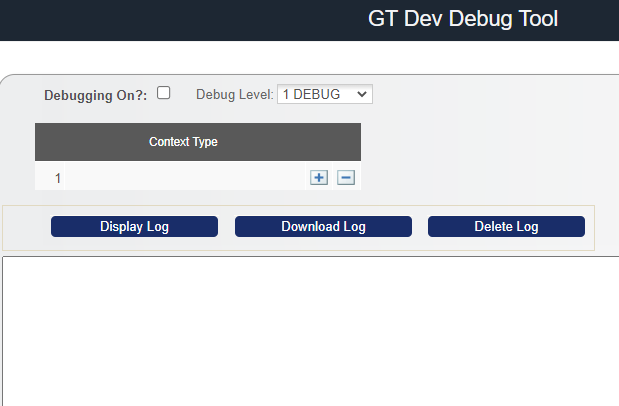
GT Dev Debug Tool
When enabled, this tool will return the code for any action taken once the “Debugging On?” button is checked. The tool should be opened in the same browser window as the target page to successfully view the code.
Navigation: Manage GT eForms 3.x > GT Utilities > GT Dev Debug Tool
| FIELD | VALUE/USE |
|---|---|
| Debugging On? | Check box to turn debugging feature on. |
| Debug Level | Select the code level 0 – All 1 – Debug 11- DEP 2 – Info 3 – Warn 4- Error 5 – Fatal 6 – Tuning |
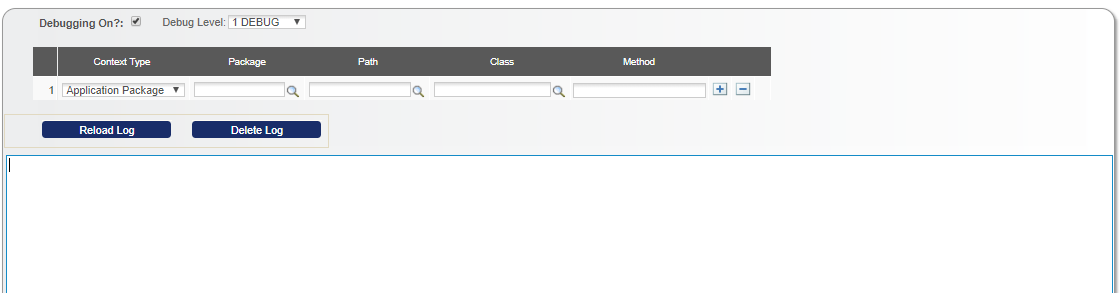
| Context Type (dropdown) | When debugging on is checked, dropdown options include: Application Package PPC, Component/Record PPC, Page PPC |
| Add Button | Adds an additional Context Type |
| Delete Button | Remove the selected Context Type |
| Display Log | Displays logs |
| Download Log | Downloads logs |
| Delete Log | Deletes logs |
Context Types
Three different context types can be filtered. The values of the subsequent fields should be filled in and then naviagte to the component and trigger the code.
Application Package
| FIELD | VALUE/USE |
|---|---|
| Package | Enter the name of the application package |
| Path | Enter the path name of the application package |
| Class | Enter the class name of the application package |
| Method | Enter the method to be called |
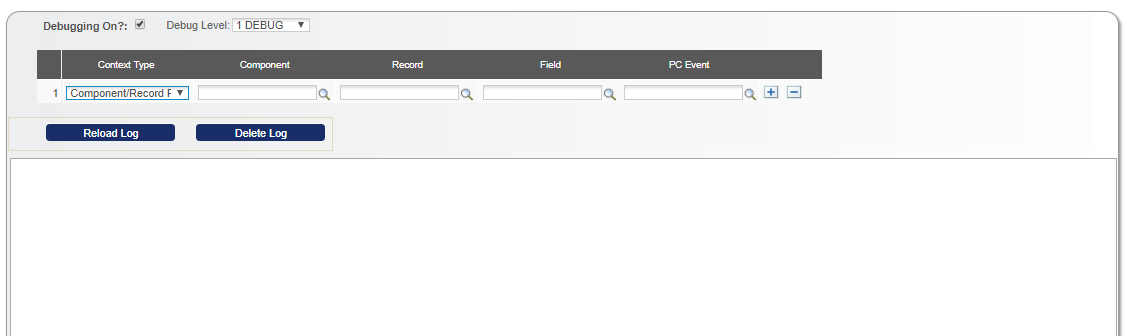
Component/Record PPC
| FIELD | VALUE/USE |
|---|---|
| Component | Enter the component name of the PPC |
| Record | Enter the record name of the PPC |
| Field | Select the field of the PPC |
| PC Event | Enter the PC event to be called |
Page PPC

| FIELD | VALUE/USE |
|---|---|
| Page | Enter the page name of the PPC |